We continually hear about the "affordability crisis" and how the three major levels
of government need to better support affordability for everyday Canadians
across costs in;
• housing
• food
• energy
• dental
• transportation
• child care
• health care
• education
• municipal taxes
The Bank of Canada and Statistics Canada assure us inflation, by measures of CPI, are well
within target range; but, somehow that doesn't feel right. Even for high earners,
there is less to go around. In the past year, CPI is being quoted at 2.1%,
while the 5-year compound annual growth rate (cagr) is 3.8%. There are various wage increases
quoted from a low of 2.5% to a high of 3.5% over periods of 20 to 4 years, respectively.
Yes, it does get confusing.
Municipal Taxes
The yearly ritual presented in Canadian cities is the budget review for the coming year.
The process can be muddled; the actual budget is not discussed, rather, the discussion turns
on amendments; there is no discussion as to whether the prior year's budget was spent effectively.
The coming year requires greater expenditure to cover all the usual factors; prominent among these
is municipal population growth, staff increases, maintaining service levels, contractor cost and other demand side increases.
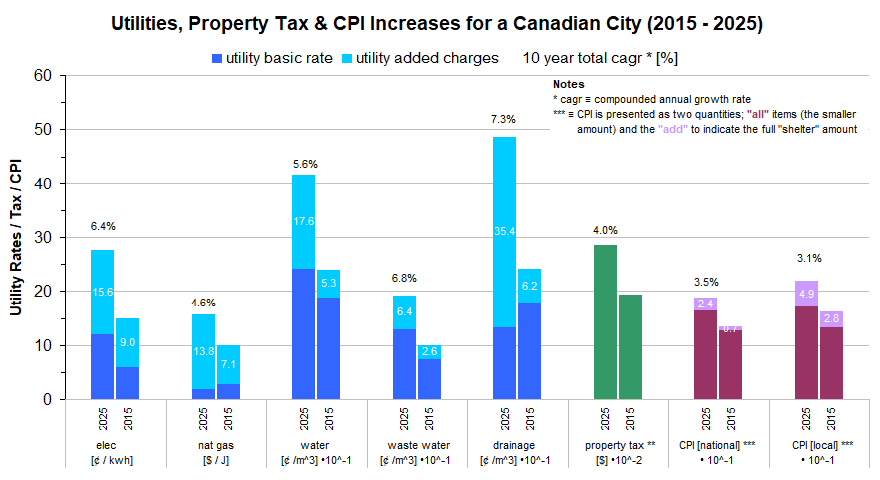
Property Tax / Utility / CPI Increases
The figure below covers a 10 year period for a specific municipality; most of the
utilities are supplied by the municipality. The charges rely on ever increasing fees to the
base utility rate with, generally, both fees and basic rates doubling at 10 year interval pace
which reach or exceed twice the rate of CPI increases. Those fees include charges by the municipality.
The property tax increase appears to be less onerous but obscures that new revenues have been raised
as additional "fees" included in added utility charges or as completely new / separate
utility billlings. For example, the waste collection charge for one city increased by 9x
after removal from the property tax bill to a separate charge;
the compound annual increase was 9.5% over a 24 year period.
It's too ironic that municipalities are seeking to identify ever more revenue streams in order
to appear to be holding the line on property tax increases.
An Affordability Solution
The politicians' and bureaucrats' (federal, provincial, municipal) solution to the
affordability "crisis" seems to be for provincial & federal governments to increase budget
deficits and debt while for municipalities, to find additional revenue streams i.e.,
taxation by another name. By law, municipal governments cannot run with deficits but may
tax to satisfy expenditure needs.
From the example above, consider how property tax increases and utility charges have
outpaced national and local CPI indicators.
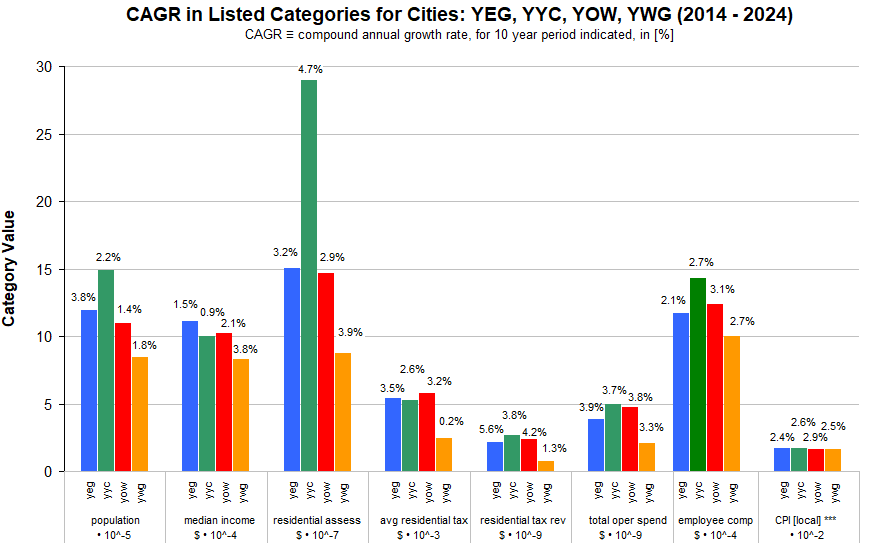
How does this compare to other comparably sized municipalities in Canada? The following
chart was derived from data in individual annual reports across selected measures.
|